SolarView
This project was developed as a result of the 2021 NASA Space App Challenge, which involved participants from around the world coming together over a 48-hour period to solve challenges submitted by NASA personnel, using open data from various space agencies.
The mobile app home page for the SolarView application.
Introduction
The 2021 NASA Space App Challenge is an annual hackathon hosted by NASA and partner space agencies that focuses on how participants can leverage data collected by space agencies for a public benefit.
Teams could select one of multiple prompts for our hackathon project.
Our Hackathon Prompt: “You Are My Sunshine”
NASA produces a variety of surface solar and meteorological data parameters that are useful to commercial renewable energy and sustainable building ventures, but this information is not easily accessible to the typical homeowner.
Our team’s goal was to develop a mobile application to access the information on NASA’s Prediction of Worldwide renewable Energy Resources (POWER) web services portal and provide useful information about sunshine to the general public.
The Hackathon Team
Our team consisted of the following roles.
A UX/UI Designer and Product Manager: I served as this role for the team, and my duties included: facilitating team work-sessions, managing the creation of user stories, building out user flows, and developing low/high-fidelity wireframes. I also worked to assign tasks to the visual designer and front-end/back-end developer.
A Visual Designer: An experienced service designer from Code for America participated in this role, and she focused on developing the logo and style tile for the application, as well as developing the user research plan.
A Front-End/Back-End Developer: A developer with prior hackathon experience participated in this role who was responsible for connecting the data from NASA’s POWER portal to the prototype that was created.
A Research Assistant: To help the back-end developer navigate the API and back-end development.
How Might We-"Bring POWER to Everyday People”?
Project Goals
Our team decided to develop a web app called SolarView that could:
Provide the ability to view the solar power levels in a local community, using meteorological data from NASA.
Provide explanations and resources for users to get started toward installing solar panels in their own community.
The app was initially configured to be displayed on a mobile device, but is meant to serve as a web-native application.
Our Stated Mission and Vision
Aid lower income and marginalized communities who aren’t aware of solar solutions, and the solar panel tracking and installation processes.
Help educate and inform communities of whom are affected or being affected by the practice of Blue-Lining.
Building knowledge about solar solutions and associated STEM/STEAM topics for young people and communities interested in the subjects, who otherwise might not have access to solar information or other environmental programs due to financial gaps.
Our Target Audiences for the Application
To develop a set of use cases, we decided to focus on the following potential audiences for our application.
Lower Income and Marginalized Communities
Policy Makers
Educators
Environmentalists
Research and Analysis
Research was done to crystallize the exact goals, needs, and frustrations of potential users of the SolarView application.
Asking People: “What Does Rooftop Solar Mean to You?”
An overview of the research process used for the SolarView app.
The team conducted interviews with four individuals who were interested or had recently installed rooftop solar for their homes. Themes that emerged from our research included
A desire to optimize how much sunlight their roof could capture
A lack of a clear knowledge about solar power resources that were available
Frustrations with an opaque set-up process
A competitive analysis was conducted on rooftop solar initiatives in local communities, and how those were implemented.
Organizing the Research
After the initial user research, we proceeded to organize what I learned through creating, a style tile, developing user flows.
Making Sense of the User Interview Results with User Stories
The introduction to the document describing the team’s Minimum Viable Product.
Based on the results provided during the user research the group decided on creating an MVP to create a knowledge base/guide for low-income communities who wanted to understand how solar panels can benefit them and their local communities, while providing an explanation of the resources available for them to get started in solar.
A series of user stories for community members and leaders who would use the apps. Example user stories included:
As a community member, I want to see a comprehensive overview of the estimated costs for installing solar panels on my roof so that I can make the best financial decision that is possible for me.
As a community member, I want to share information about solar power in my regional area so that other people can be more empowered and informed about these opportunities.
As a community leader, I want to visualize how much solar energy my community institution can capture given current weather and environmental conditions, so that I can make the best decision possible in terms of installing the panels.
As a community member/leader, I want to see a comprehensive overview of the estimated costs for installing solar panels on my roof so that I can make the best financial decision that is possible for me.
“How Does It Flow?”-Building Out the User Flows for SolarView
I proceeded to create a set of task flows for SolarView outlining how someone would navigate through the proposed mobile app. This navigation flow was based off the results of the following key user stories our team determined would be needed for the app.
Registering to Use the SolarView App
Viewing Solar Power Capacity Using the App (We considered this to be the highest priority user flow)
Viewing Additional Resources for Understanding How Solar Power Works
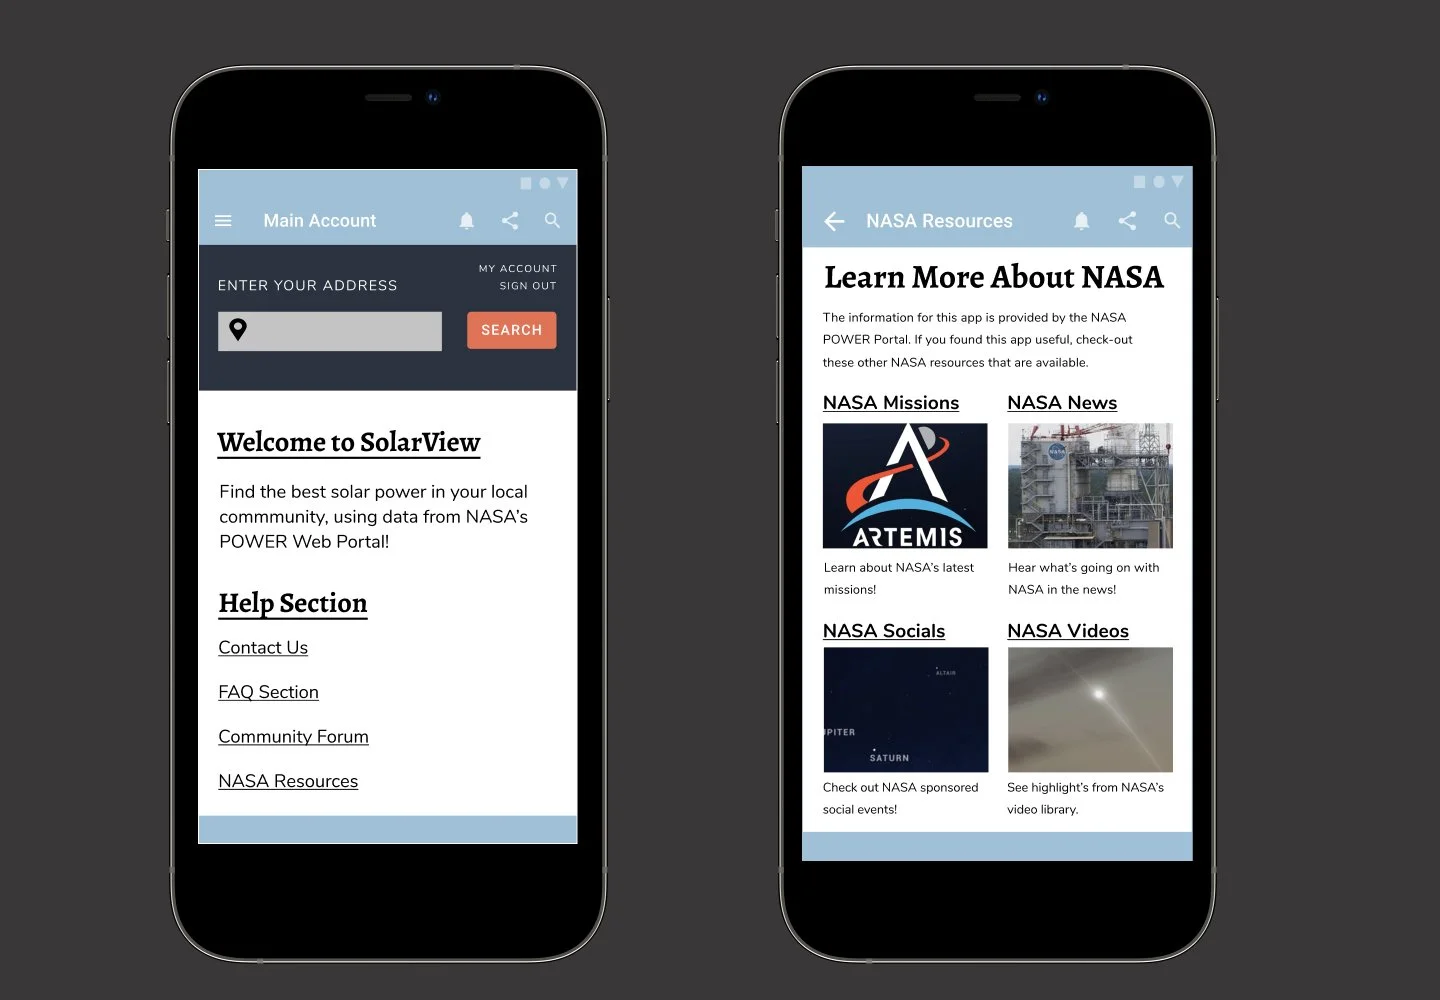
Looking Up Additional NASA Resources
Our Team’s Low Fidelity Wireframes for SolarView
Based off the user research, I created an initial set of wireframes for the mobile application version of SolarView.
Above a sample display of the low-fidelity wireframes that were created for the new workflow, which reflected the process flows built off the user stories the group created.
Developing SolarView’s Logo and Brand Identity Through a Style Tile
The SolarView style tile.
Now that our team had the outline of how the SolarView application should be organized, we needed to figure out what values SolarView’s brand identity should reflect.
During the user interviews, the interviewees conveyed the following keywords they wanted to see in a solar panel application
Helpful, Guided, “For Everyone”, Authoritative, Comprehensive
Using these key words, the visual designer proceeded to create a logo and style tile that reflected the qualitative user experience our team wanted the SolarView applicaiton to convey. This style tile is displayed above.
I then used the style tile to create a series of wireframes that were combined into a prototype.
Creation of Wireframes
Based off the results of the user research and the creation of the style tile, the following sequence of high-fidelity wireframes was created. The wireframes were meant to outline the process flows of how users navigated the SolarView Mobile App.
“The Power of the Sun”: The High-Fidelity SolarView Frames
These wireframes show a successful SolarView log-in and the home page for the SolarView mobile app.
These wireframes show how the user would search for a specific destination within the SolarView app.
These wireframes show how a use would view solar power level statistics and how the user would filter the default statistics for specific criteria.
This wireframe shows the results of the user applying a filter.
These wireframes focused on the user looking at additional NASA resources.
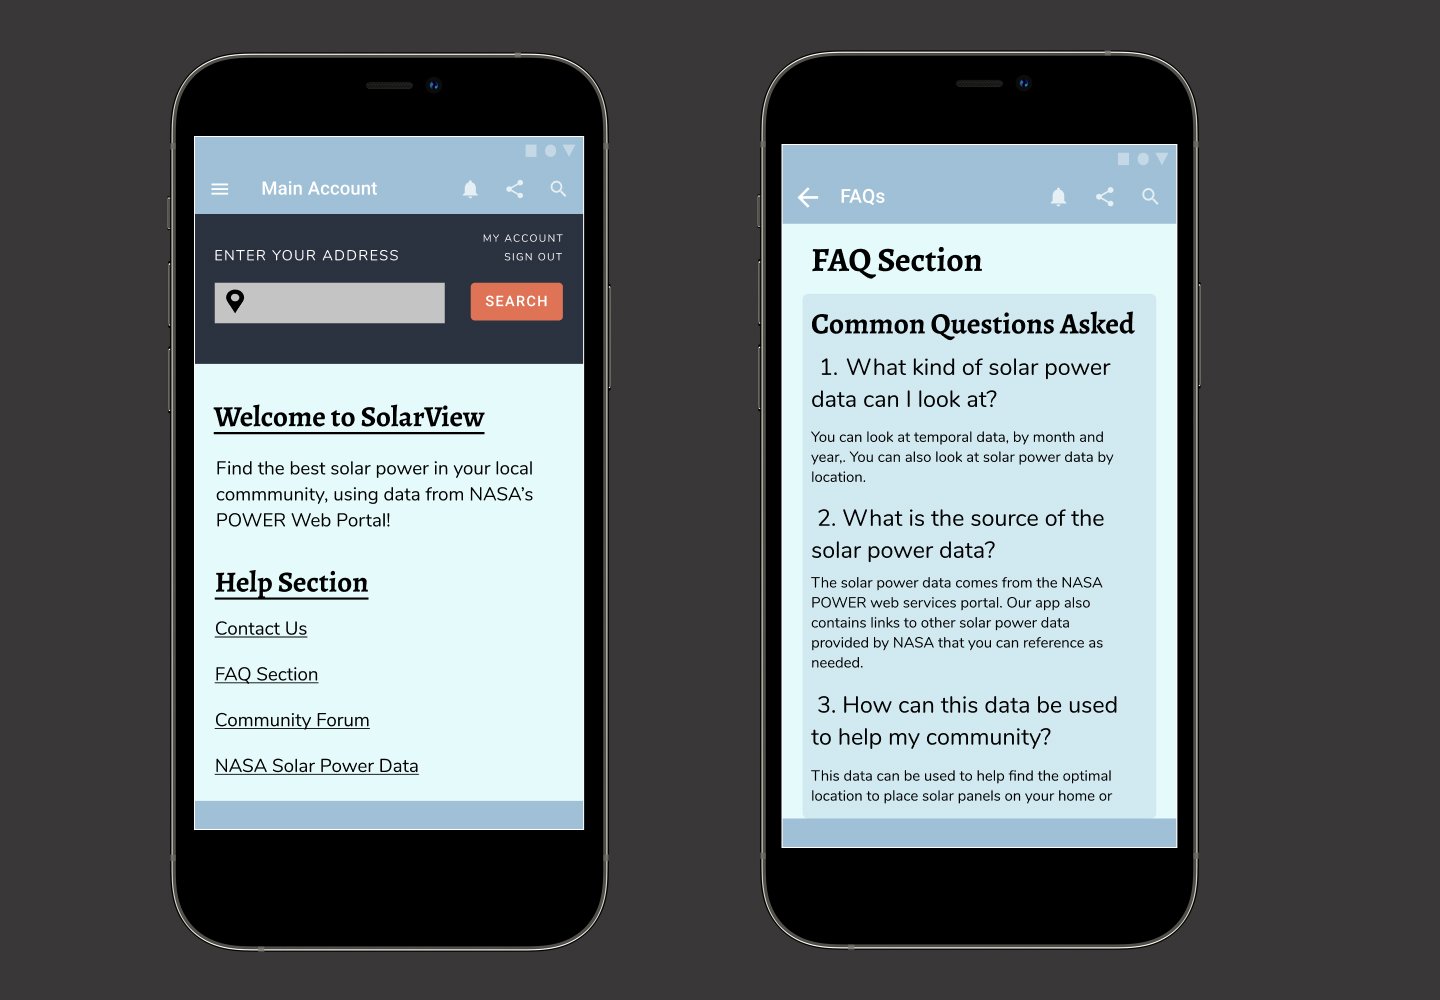
These wireframes focused on reviewing the FAQ section of the SolarView app.
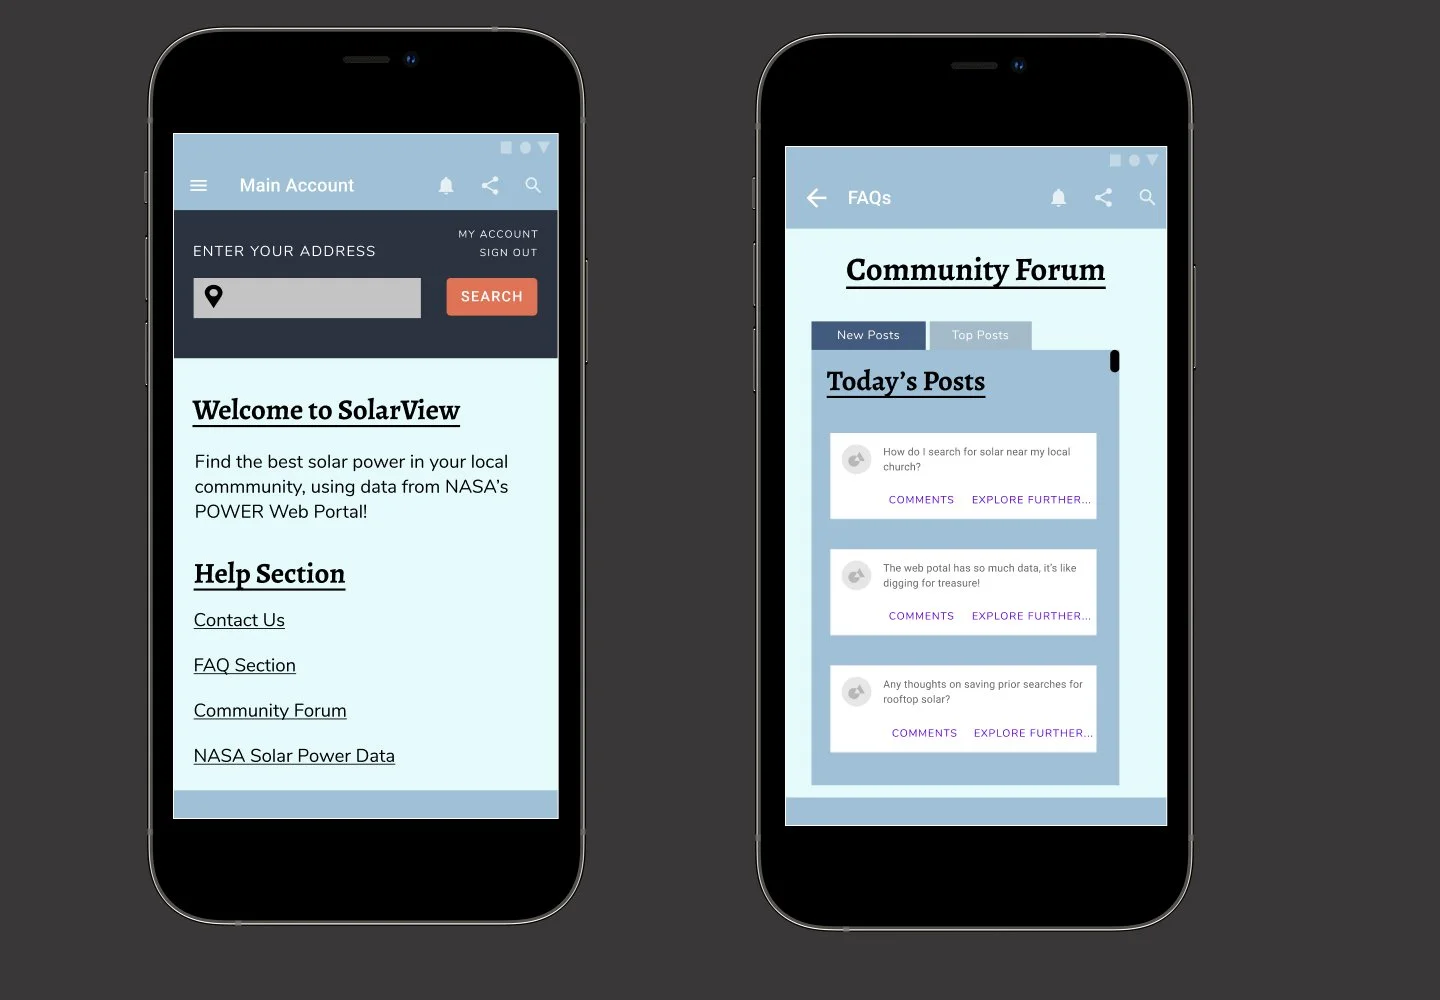
These wireframes showed a page where the user could look at a community forum.
These wireframes showed how the user would access the contact us page for the SolarView app.
Prototype and Development
After completing the wireframes, the team began to do back-end development for the wireframes.
“Let’s Connect!”- Linking the Prototype Created to a NASA Space API.
Once the wireframes of the prototype were completed, they needed to be connected to NASA Space App data.
Our team’s application used the NASA POWER API to display data about solar levels in a given area
The API was capable of displaying information such as average amount of sunlight per day and solar irradiance levels
Solar irradiance is the power per unit received from sun.
So What Happened?- The Front-End Design, Back-End Design, and Infrastructure and Deployment
The Front-End Design
Our team developer created a progressive web application (PWA) in React and TypeScript
PWAs are web applications that can be downloaded onto mobile phones
Provides a mobile native experience
Application uses geolocation services to retrieve latitude and longitude information
This information is then passed to the proxy API endpoint
The Back-End Design
The developer then designed a serverless API to mediate requests between the UI and the NASA POWER API
Created AWS API Gateway endpoint with a lambda function using Node.js and Typescript
This function acted as the proxy between the UI and the NASA POWER API
Infrastructure and Deployment
To create the proxy API, AWS CDK was used to provision the resources such as the lambda function and the API endpoint
To manage our code, we used the popular version control software called Git
We used GitHub to host our Git Repository
To deploy the React application, we used Vercel as the host
Vercel connects to our repository on GitHub and updates the site whenever changes are detected
Conclusion
The prototype was presented to a group of NASA-affiliated judges who evaluated the work.
The Team Presentation
Our team presented our prototype and background research to the hackathon judges for evaluation. The presentation was 10 minutes long.
The Results
Our team received honorable mention for our SolarView project by the NYC Space Apps Hackathon judging panel.
A judge on the hackathon panel expressed interest in our work, and offered to work with us in further developing the application.
Moving Forward with the Next Steps for SolarView
After the prototype revisions were made, the following steps would occur:
The team would conduct a formal usability test of the prototype to see if the basic functionality made sense.
A web-app first version of the SolarView application would be created.
A set of prospective people who had use for the SolarView app would be contacted.
Lessons Learned
The learnings from the case study were as follows:
For any new user experience, we needed to identify the keywords associated with the experience, i.e. resourceful, friendly. Once these keywords are found, the designer can develop the color palette and typography that reflects those keywords.
Our team realized we couldn’t have our app do everything, so we focused on making sure we could fulfill the ‘must-have’ requirements articulated in the challenge
Our team ran into obstacles that prevented us from easily accessing data, or coming up with an initial set of viable use cases. We had to develop workarounds to allow our original goals to adapt to sudden environmental constraints.


